Profile Kernels using NVIDIA Nsight Compute
This tutorial provides instructions on profiling CUDA kernels written in Julia using NVIDIA Nsight Compute. The instructions are based on a local Windows system (and similarly apply to Linux and macOS, including both remote and local systems) and use the VS Code platform.
Prerequisite
Make sure to download the version of NVIDIA Nsight Compute that is compatible with your NVIDIA driver.
Connect to Externel Julia REPL
First, we start by launching a Julia session under the Nsight Compute CLI using the following command:
> ncu --mode=launch juliaThen, we will enter a Julia REPL showing that it is waiting for a profiler to attach. To better support kernel optimization, we recommend connecting this REPL to your current development IDE. Please note that this Julia REPL (i.e., the terminal, which is commonly referred to as such in IDE platforms) is considered an external REPL with respect to the IDE.
We are now taking the VS Code as our example.
In the command palette, search for Julia: Connect external REPL and select it. This will automatically copy some lines of code to your clipboard. Execute these lines in the external REPL we have already launched, and the connection to the external REPL will be successful.
Attach Profiler to Julia Process
Now we are ready to attach the externel profiler (i.e., Nsight Compute) to the existing Julia process.
First, enter the following command into the REPL we launched earlier:
julia> using CUDAAs soon as you use CUDA.jl, your Julia process will hang.
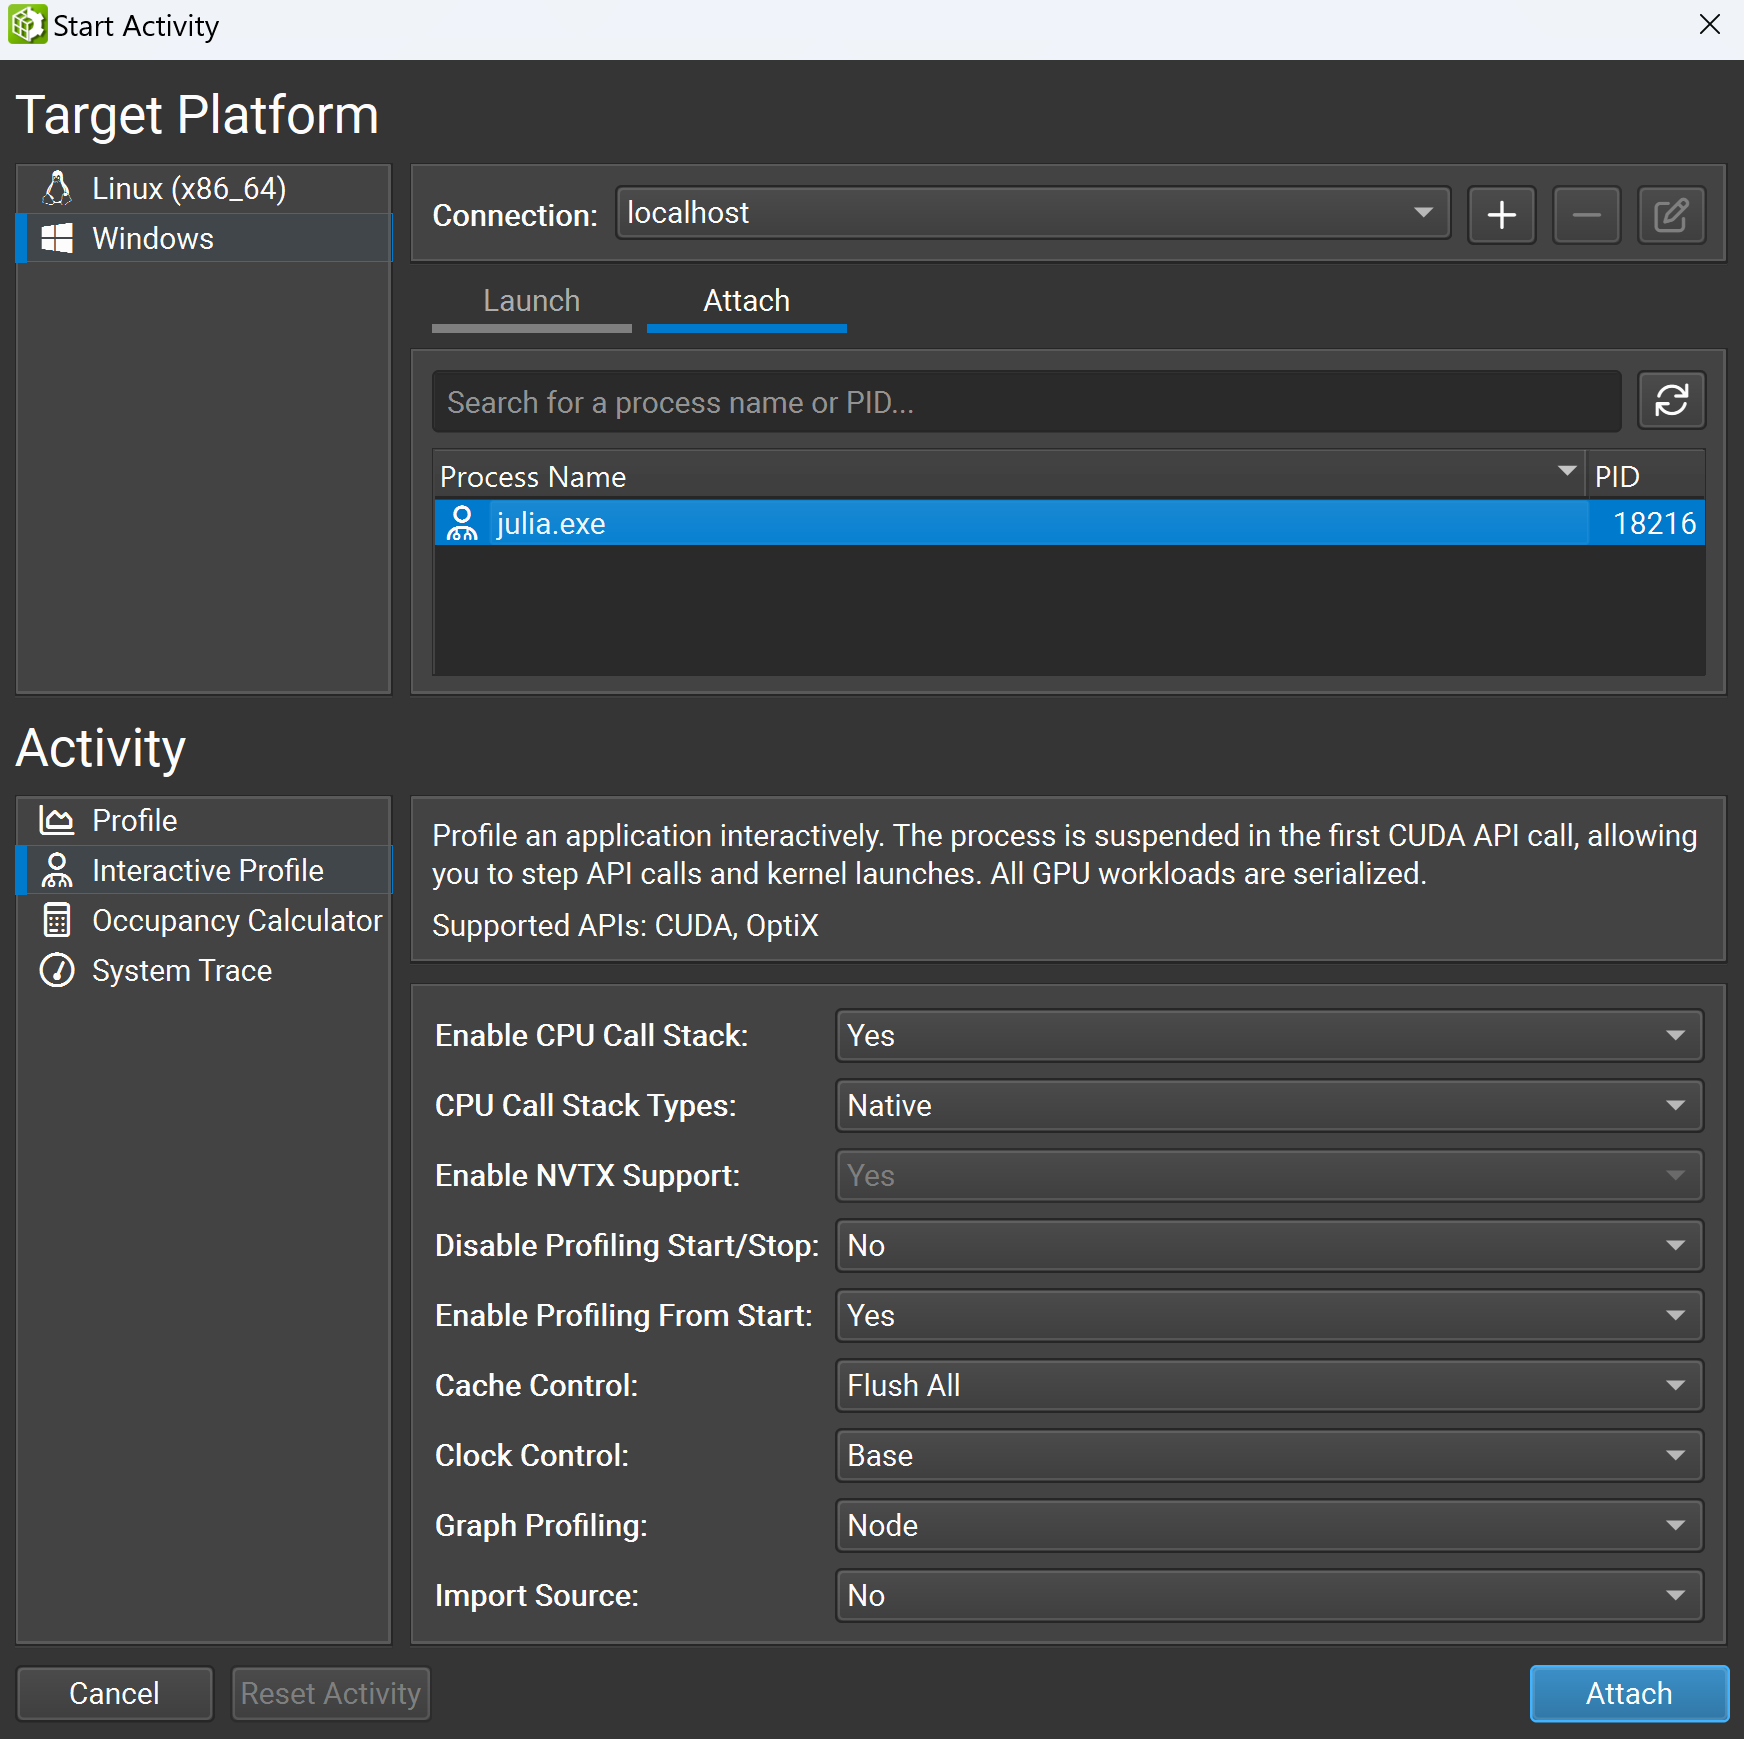
Then, open the Nsight Compute GUI, select Connection > Start Activity, and a new window will appear. Choose Attach, select your julia.exe under the Target Platform section, select Interactive Profile under the Activity section, and then click the Attach button.
You will now successfully attach the profiler to the Julia process. Next, check Profile > Auto Profile to enable the profiler to automatically profile kernels and uncheck Debug > Break On API Error to prevent halting the process due to innocuous errors. Then click Debug > Resume to resume your application.
You will find the REPL comes to life again, and we are ready to profile our kernels.
Start GPU Kernel Profiling
You can try with some simple examples. First, you can try to run some commands directly through REPL:
julia> a = CUDA.rand(1024, 1024, 1024)
julia> sin.(a)
Then, you will see profiling statistics appear in the Nsight Compute GUI. You can also try with some custom kernels written in the Julia script. For example,
function vector_add_kernel!(C, A, B, n)
    idx = (blockIdx().x - 1) * blockDim().x + threadIdx().x

    if idx <= n
        @inbounds C[idx] = A[idx] + B[idx]
    end
end
Nsight Compute is a powerful tool with a large number of features for kernel optimization. For more information on how to utilize Nsight Compute, please refer to the official documentation in the references.
Profiling in Package Development (Optional)
This section is optional for users but strongly recommended for developers. When developing a Julia package, the code is precompiled before running the kernels, which may trigger multiple Julia processes, each making its first call to the CUDA API.
Take TrixiCUDA.jl as an example. First, we need to precompile the package:
(TrixiCUDA) pkg> precompileThen the process will hang (and may hang multiple times). As described in the Attach Profiler to Julia Process section, this time we need to attach each Julia process to the profiler and resume the application for each one to ensure the precompilation process continues.
After precompilation, we can use TrixiCUDA.jl directly in our Julia script without any errors. Note that the first time you use TrixiCUDA.jl in the Julia session:
julia> using TrixiCUDAthe REPL will hang again. To proceed, repeat the attach and resume workflow.
Here, we also provide a sample Julia script for developers to profile kernels in the semidiscretization process in TrixiCUDA.jl. See profiling.jl - it is outdated, please wait for an update.
References
© Trixi-GPU developers. Powered by Franklin.jl and the Julia programming language.